Hello,
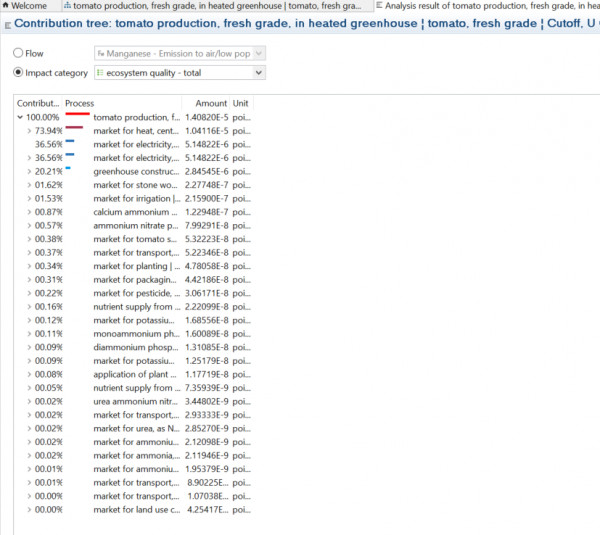
I'm trying to model a greenhouse tomato production. I've found a process that looked pretty much like what I wanted to model: tomato production, fresh grade, in heated greenhouse. When I look at the results in the contribution tree, I find that the ecosystem quality total percentage aren't adding up to 100% but to more than 130%. I've been told that it may be because this process consume heavy metals so there would be negative fluxes that would explain this difference. But I wondered why I couldn't see these negative fluxes in the contribution tree?
In short, I want to know how to plot the relative importance of each process in the total score of a category if I don't have the real 100%.
I'm using version 1.7.0.
Thank you for your help.
