0 votes
123 views

I have a product made of four parts: P1...P4. Of each part I know mass, manufacturing process, material, EoL scenario. I'm using the IDEMAT ecoDB.
My intention is to model the LCA in order to have the impact of each phase (PreProd, Manufacturing, Use, EoL) of each part.

How do I model the LCA in order to have an output similar to this image?
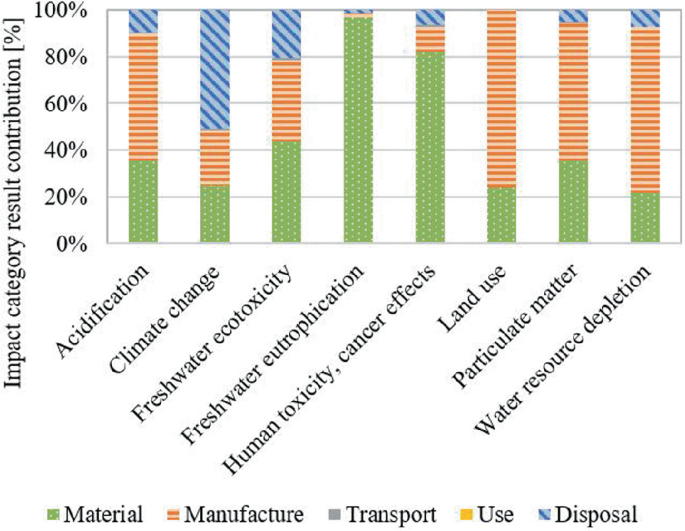
I looked at the YouTube tutorials and the ones that were closer to my use case were the PET bottle and the Scooters.

From what I gathered, I should follow this process (I will take P1 as example):

  1. PRE-PRODUCTION
    I create a P1_PREPROD flow of type "Product", with "Amount" unit.
  2. I create a P1_PREPROD process for it, that takes as input:
    - [mass] amount of [idemat_material] from [idemat_provider]
     
  3. MANUFACTURING
    I create a P1_MANUF flow of type "Product" with "Amount" unit.
  4. I create a P1_MANUF process for it, that takes as input:
    - 1 unit of P1_PREPROD flow
    - [mass] amount of [idemat_injection_molding] from [idemat_provider]
     
  5. USE
    ...
  6. TRANSPORT
    ...
  7. EOL
    ...

Recursively, unit I end up with four product flows: P1_PREPROD, P1_MANUF, P1_TRANSPORT, P1_USE, P1_EOL. Then:

  1. I create a P1_LIFECYCLE "Product" flow, "Amount" unit.
  2. I create a process for it, that takes as input:
    - P1_PREPROD
    - P1_MANUF
    - P1_TRANSPORT
    - P1_USE
    - P1_EOL
  3. Add this new created process to a product system
  4. Run the analysis

Is that correct or am I missing something here? This all looks VERY complex to me, but it's what I understood from the videos...

in openLCA by (120 points)

2 Answers

0 votes
by (125k points)

Yes, that looks complicated indeed. There are several ways, a rather straightforward one is to build one product system for each stage, and make one process ("life cycle" or so ) where you feed all inputs from these product systems into. You need to add these LC stage product systems to a new product system with the life cycle process. This is a bit similar to your approach but you do not need the P1 etc. processes and products.

We will have analysis groups in a next release, you will be able to select processes in the model graph and their results with supply chain but without double-counting will be shown separately in the results. This will be quite useful for EPDs etc. (and in your case as well). It is already implemented but waiting for the next release which we plan still this year.

by (1.7k points)
Hi,
we sometimes also model this way and cover it in the basic training. In the manual, you can find a similar approach for EPDs: https://greendelta.github.io/openLCA2-manual/epds/calculate_impact_assessment.html but I will add an example soon displaying modeling according to life cycle stages.
0 votes
by (1.7k points)
Hi,
we added now an example to the manual:
https://greendelta.github.io/openLCA2-manual/conceptualguideline/index.html
In the "If you are interested to display impacts per life cycle stage click here" part. You will see basically what we discussed in the other answers.

Best
by (140 points)
Hi,
I have an additional question. I am running into a similar problem. I would like to achieve the displayed graph in the original post and follow the same approach however calculating the individual product systems P1-P2-etc does not lead to results comparable to the image.

How can I achieve this graphical depiction? Do I need to create a project comparing the separate product systems to achieve this result?

Would love to her how to approach this!

Best
...