It looks like a downstream process in the model graph initially ...
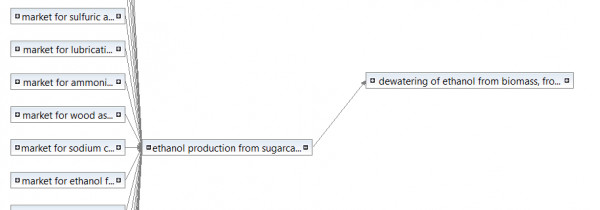
... but it is a loop: like for electricity, to produce ethanol there is some amount of ethanol used in the supply chain. When you expand the nodes in the model graph and follow the input-output paths you should come back to the ethanol production process:
ethanol production
-> dewatering of ethanol
-> market for ethanol
-> ethyl tert-butyl ether production
-> market for ethyl tert-butyl ether production
-> phenylenediamine production
-> market for meta-phenylene diamine
-> seawater reverse osmosis module production
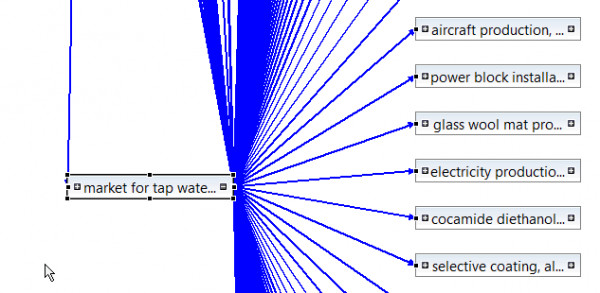
-> tap water production
-> market for tap water
-> ... and tap water is then used in many processes
-> ...
-> ethanol production