0 votes
211 views

Hello,

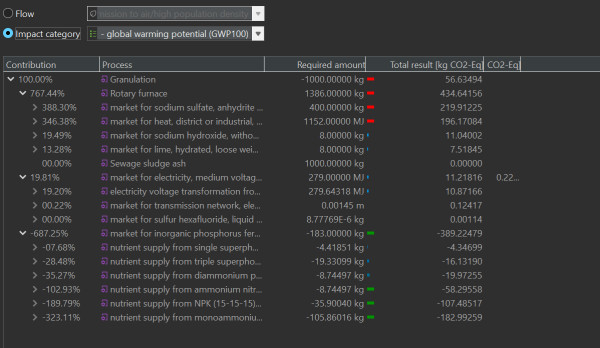
I am checking the results of the impact categories calculation (used eager/all option, IPCC 2021 method). When I compare the values of the contribution tree with those of the sankey diagram, I notice they are not the same. In the sankey diagram the values have a different order of magnitude than those in the contribution tree (for the same impact category, GWP100). Additionally, due to this inconsistency, the values in the sankey diagrams don't add up, as shown in the attached picture:

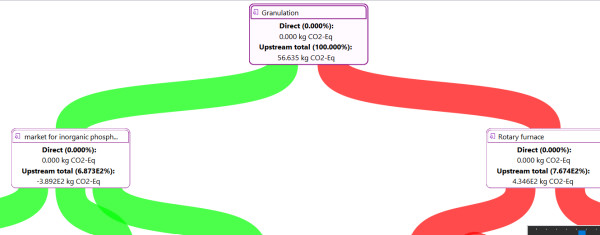
I am wondering if this is an error of the software or if I am doing something wrong that I can fix. Thank you for your help.

This is the contribution tree for the same impact category

in openLCA by (140 points)
edited by

1 Answer

+1 vote
by (13.5k points)
It would be good if you could also share a picture of the upstream tree result. You probably applied a cutoff in the Sankey diagram (?) and this is why not all links and contributions are shown. Also, the upstream tree and Sankey diagram show fundamental different things: while the upstream tree unrolls all supply chain paths (which are then infinitely depth when there are loops in a system) with often the same process in many different paths, the Sankey diagram aggregates the paths for each process to a single point. So when a system is not just a simple tree, the Sankey diagram and upstream tree will always show different results along the paths.
by (13.5k points)
Note that the values in Sankey diagram are in scientific notation (E2 means "* 100"), they are indeed the same. With cut-off I mean the cut-off that you can set in the settings of the Sankey diagram. Also, you should really check your model because of the negative required amounts (maybe you linked processes in loops where they consume more of their own products than they produce).
...