I guess the answer is both times no ;)
It is not a bug and you are not doing the export incorrectly - the excel sheet is not ordered by impact, and thus maybe the higher contributing processes that you miss are hidden in the screenshot? Or, could you post a picture with the "top contributor bar chart" and the corresponding columns in excel? As e.g.
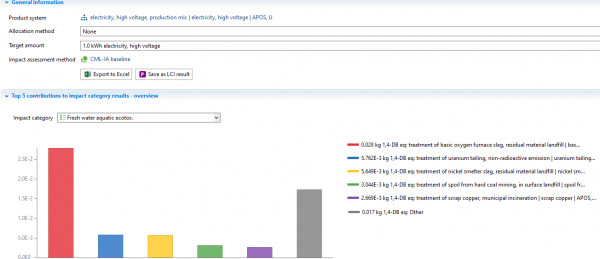
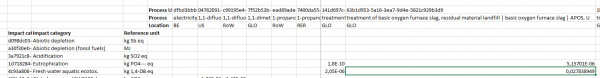
(a bit small, but the top contribution in aquatic ecotoxicity is reported with the same amount in excel).
Best wishes, thank you,
Andreas
