Hi, if I understand your question, you want to see to which processes this coal mining process is delivering to; this can be seen in the contribution tree if it is one concentrated delivery; if coal mining delivers to many processes this might be scattered over the contribution tree. Another option is the sankey diagram, if you set the filter to higher percentages.
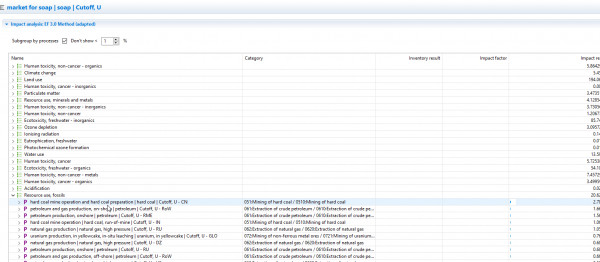
E.g. (similar example), market for soap,

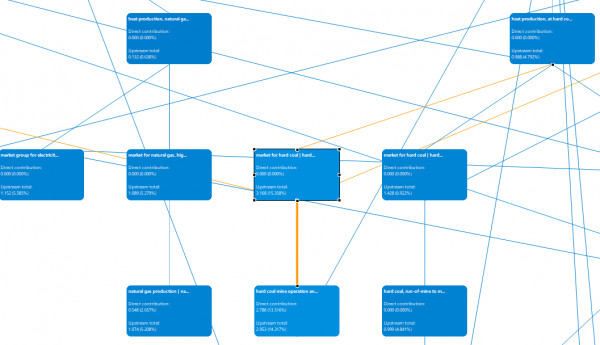
For fossil resources, hard coal mine is most contributing. In the sankey diagram, you find this process (for the same impact category of course) and you can see where it is delivering to:
To market, and then to heat production e.g..
