 Hi,
Hi,
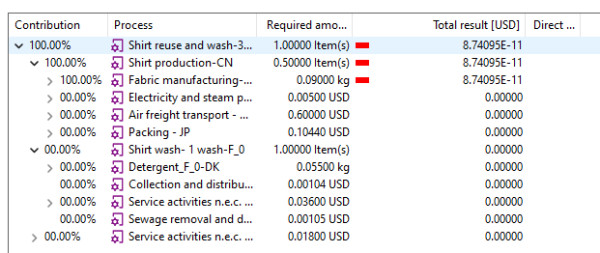
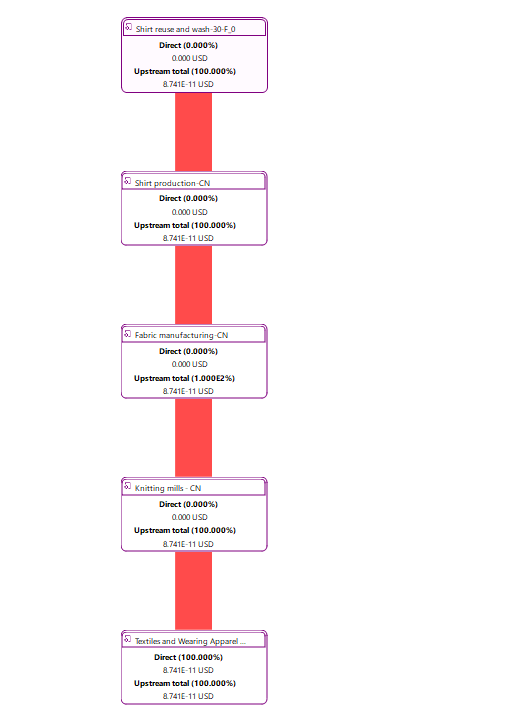
I hope you are doing well. I modeled a process for social life cycle assessment. The results under socil assessment tab show different. When I go to Sankey diagram for the same process, it is all zero and there is no Sankey diagram. What could be the reason?
Thank you for the time and would be thankful if you could guide me through as it is urgent for me
I sent a screen shot of the contribution tree
Regards
Hi again and thank you for the quick reply
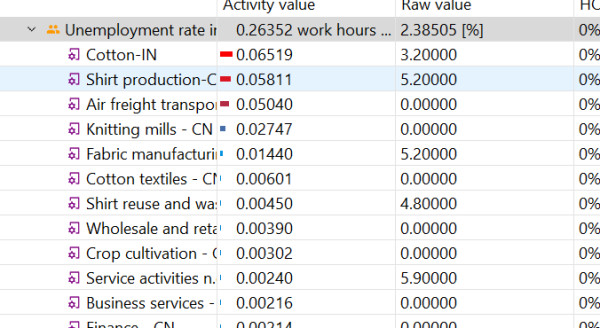
I have another issue that I need your guidance. in social assessment tab I have the hotspots as:

But in sankey diagram, Cotton-IN is not among the processes or sectoral flows that contributes most to the this social indicator
 I am not using impact weighting method for the assessement but when I use this assessment method, I have the upper problem. no Sankey diagram
Regards and thank you for the help

