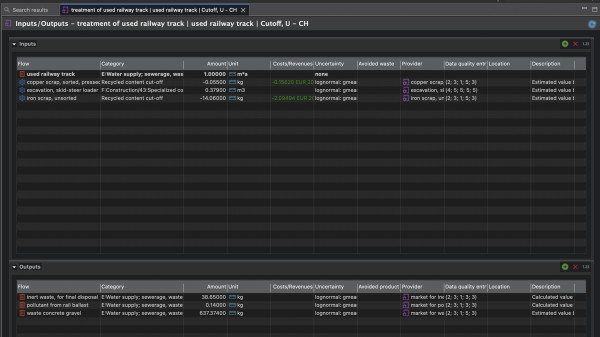
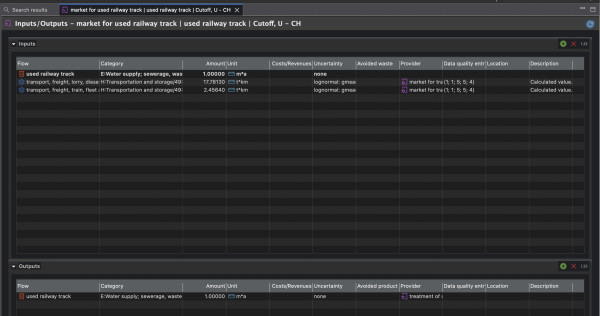
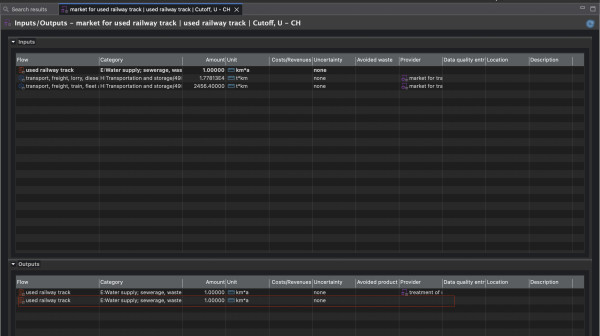
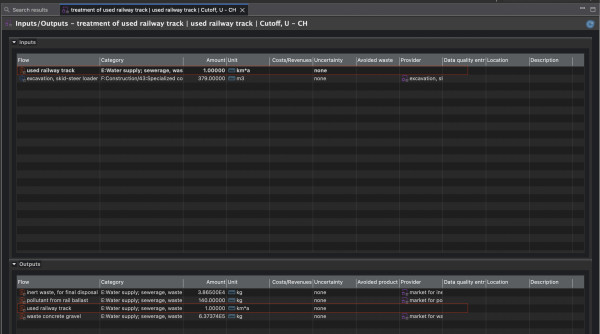
I encountered these anomalies in the following two datasets:
1. market for used railway track
2. treatment of used railway track.
I noticed that in the first dataset, the ‘used railway track’ flow appears twice in the output, whereas there should only be one.
In the second dataset, however, ‘used railway track’ appears in both the input and output, where it should not be present in output.
The anomalies are shown in the attached images.
These anomalies do not occur in the Ecoinvent database for the same datasets.
If you use a database that has the Ecoinvent library as its background data and a calculation model as its foreground, you obtain anomalous results that call into question the accuracy of the study.
In my case, the difference in the result is approximately 6.5% of the total, but in the maintenance process using the aforementioned datasets, it is 17%. I have compared the results obtained from the same model calculated using the Ecoinvent database and the Ecoinvent library.
I have manually corrected the library datasets, and the result now aligns with that obtained from the model based on the Ecoinvent database rather than the library.
I believe this is an issue with the creation of the library.
If one wishes to create a tool to apply the systematic approach, the use of the library becomes critical because the anomaly is not immediately apparent.