Hello,
My question is similar to the 'monte carlo results' question answered a few days ago however I cannot fix the problem from the answer provided.
I am having trouble with my monte carlo simulation graphs and do not know how to resolve this. I have input uncertainty data through the pedigree matrix approach for every process and flow used in my product systems. I run 10,000 iterations for impact 200+ endpoint and my graphs are showing as the following for both product systems I am comparing in my LCA.
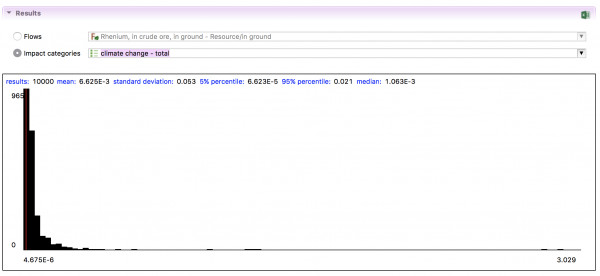
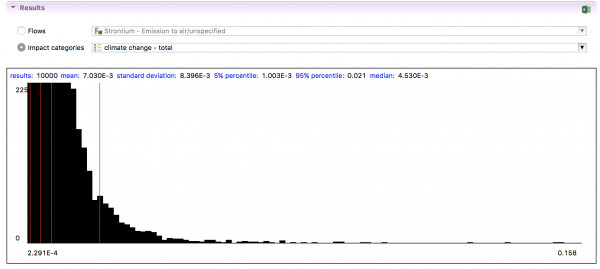
If the update on the 'monte carlo results' question of changing the standard deviation applies to my graphs too, I am unsure how to do this as I thought the simulation calculates the standard deviation?
Also, as the y-axis exceeds 225 points, I cannot plot the graph on excel and I am confused about how to do this.
Any help is much appreciated,
All the best.
